How to Evaluate Indoor Playground Profitability Before You Invest
You can figure out if your indoor playground investment will make money before you spend anything. Start with the market, then add up all the costs, then look at the money you could bring in. This guide walks you through each step. Use your own numbers for every step.
If you skip this work, you might put your indoor playground investment into a place that never does well. That happens a lot. Indoor play areas usually make a net profit of 15% to 35%, and many businesses earn back their startup money within 2–3 years if they run well. Bad guesses can push your indoor playground investment below that range.
Checking profitability takes careful work, not guessing. The steps below show you how to figure out your indoor play area’s profitability with confidence.
Key Takeaways
- Check out local families and other playgrounds nearby to make sure there is enough demand for yours.
- Write down all the costs to start and the monthly costs. This helps you see your total investment.
- Figure out your monthly profit by guessing how many visitors you will get and taking away your costs.
- Figure out the payback period to see how quickly you get your money back.
- Check your plan with a business plan, and set clear benchmarks for deciding whether to go forward or not.
Run an Indoor Playground Market Analysis
Market research is one of the two key steps to confirm viability. The business plan comes later. This indoor playground market analysis tells you whether enough families will pay for your venue. Skip it, and your numbers rest on hope.
Gauge Demand and Competition
Your indoor playground market analysis starts with foot traffic drivers. Look at schools, housing developments, shopping centers, and highways near each site. Then study local family demographics. Count households with children in your target age range. Check income levels and weekday versus weekend patterns. Drive past candidate sites at different hours. Watch stroller traffic and parked cars. A dense neighborhood with few young families will underperform a smaller area full of parents.
Next, visit nearby competitors. Note their pricing, attractions, cleanliness, and busy hours. This step reveals gaps you can fill. Write down what each rival does well and poorly. Then draft a one-sentence positioning statement. Your positioning should give families a clear reason to choose you. A strong indoor playground business solves a problem the competition ignores. Do this market research to open your indoor playground before you sign a lease. It shapes every later decision about opening your indoor playground.
Map Revenue Streams
List every way your venue can earn money. Admission fees, memberships, party packages, food and retail, and ancillary services all matter. Your indoor playground revenue should never depend on one stream alone. A resilient indoor playground business mixes several. Some streams need extra staff or permits.
The table below shows typical revenue shares for three core streams. Treat these ranges as directional. Your location, venue size, and attractions will shift the mix. Every indoor playground business needs a clear mix.
| Revenue Category | Typical Share of Total Revenue |
|---|---|
| Walk-in Admissions (pay-per-entry / hourly passes) | 25–40% |
| Birthday Parties & Private Events (packages, add-ons) | 15–30% |
| Memberships & Passes (monthly/annual) | 5–15% |
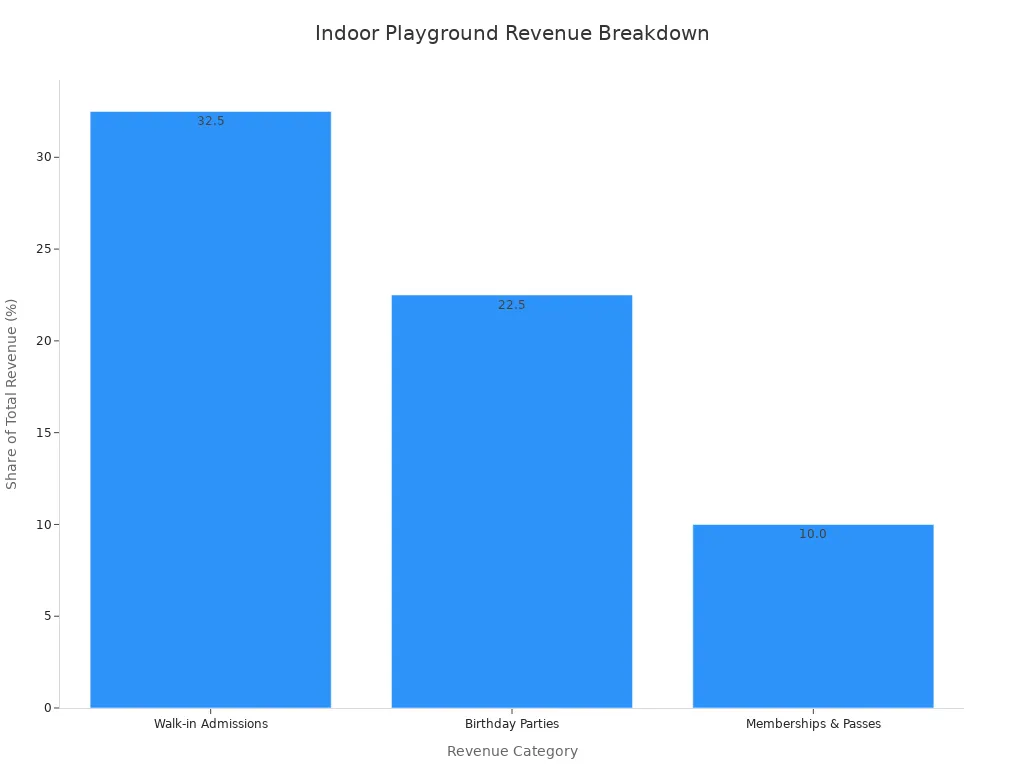
Party packages often carry higher margins than walk-in tickets. Memberships build predictable cash flow. Food and retail add small but steady gains. Ancillary services such as classes or camps fill quiet hours. Map these streams before you estimate any indoor playground cost. A clear view of indoor playground cost keeps your indoor playground business honest. This habit protects profitability from day one. Revisit the mix as real sales data arrives.
Size Your Indoor Playground Investment
Four budget factors drive your indoor playground investment: location, facility type, equipment scope, and build-out. If you get these wrong, new owners often spend too much before opening day. Size each factor against your own plan.
Startup Costs to Budget
Your indoor playground startup cost depends a lot on venue size. Use the ranges below as planning anchors, not quotes.
| Venue Size | Estimated Total Investment |
|---|---|
| Small indoor playground (100–300 sqm) | $20,000 – $60,000 |
| Medium family entertainment center (300–600 sqm) | $50,000 – $120,000 |
| Large commercial playground (600–1,500 sqm) | $100,000 – $300,000+ |
Equipment usually takes up 30% to 50% of that total investment. Rent, renovation, installation, and operating reserves make up the rest. In square-foot terms, most indoor playgrounds cost between $75,000 and $1 million to open, depending on facility type. A small play café of 2,000–4,000 sq. ft. might run $75,000–$250,000+. A mid-sized indoor playground of 5,000–10,000 sq. ft. often lands at $250,000–$750,000+. Large facilities above 10,000 sq. ft. can go over $1M.
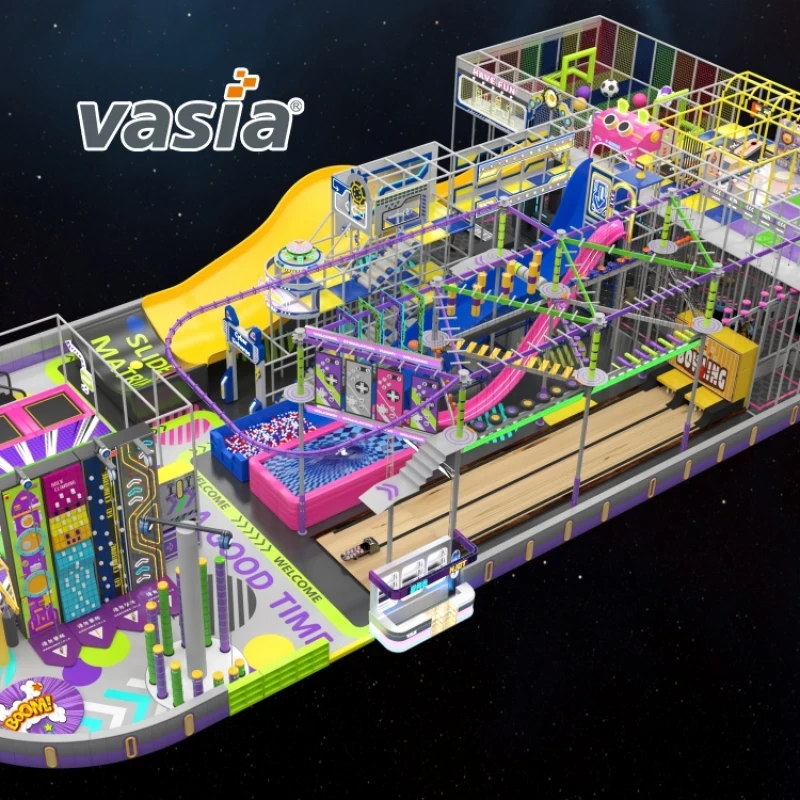
Equipment pricing changes by structure. Expect roughly $140 per square meter below 3.2m of height and about $200 per square meter at 4.5m. A 200 square meter, two-level structure runs near $28,000; a three-level version near $40,000. Equipment alone usually falls within $35 to $100 per square foot of play area. Sourcing from a customizable supplier such as Vasia Indoor Playground affects both upfront indoor playground cost and long-term maintenance. Plan the play area before you finalize the indoor playground cost, and confirm the financing necessary to create your indoor playground before signing anything.
Monthly Operating Expenses
Recurring costs decide whether your indoor playground business survives its first year. Rent and insurance stay fixed. Insurance alone runs $8,000 to $25,000 in year one, or roughly $667 to $2,083 per month. Staffing, utilities, maintenance, and marketing add pressure. Seasonality makes this harder: a venue might bill $85,000 in February but only $28,000 in July while rent and insurance hold steady. Utilities surprise new owners too—high ceilings in a 2,500 sq ft space pushed one electric bill several hundred dollars above estimate each month. Budget for labor and training, paper products, inventory replenishment, and cleaning supplies. Every indoor playground business needs a cash reserve for the slow months. Track these figures monthly, and your indoor playground cost model stays honest.
Project Profitability and Payback

ROI framing compares your startup costs against projected monthly cash flow. This comparison judges three things: profitability, cash flow strength, and long-term sustainability. Pull the revenue and cost figures from your earlier work. Then test them here. A strong indoor playground business passes this test before signing a lease. Your indoor playground investment deserves that discipline. Skip this step, and your indoor playground business plans on guesswork.
Build a Profit Projection
Start with your indoor playground revenue estimate. Multiply expected monthly visitors by your average ticket price. Add party bookings, memberships, and secondary spending. Subtract monthly operating expenses. The result is your projected monthly cash flow. Small changes in visitor counts swing this figure sharply. Test a low, mid, and high scenario.
Divide annual net profit by total investment. That ratio is your indoor playground ROI. A well-operated asset often targets a 30 to 40 percent annual return. Some published benchmarks report far higher figures, such as 70%–200% per annum. Treat every benchmark as an illustration, not a promise. Your indoor playground profit margin depends on pricing discipline and cost control. Track your average profit margin against these ranges each quarter. A healthy ROI gives your indoor playground business room to absorb slow months.
Break-even analysis turns these numbers into a decision tool. Break-even revenue equals fixed costs divided by your contribution margin ratio. Financial projections indicate break-even at a monthly revenue of about $65,281 for a typical operation. Comparable venues often exceed that level within the first month after opening. A well-managed commercial indoor playground of 500–1,000 sqm typically reaches break-even in 12 to 18 months. One exceptional case broke even in 2 months, but that is an anomaly, not a norm. Model your indoor playground cost against this threshold before you commit.
Estimate the Average Payback Period
The indoor playground payback period tells you how fast the venue returns your capital. Divide your total investment by average monthly net cash flow. The result is the number of months to recover your money.
Payback varies by facility type. The table below shows typical ranges.
| Playground Category | Key Characteristics | Payback Period |
|---|---|---|
| Entry-Level Soft Indoor Playground | Ceiling ~3–3.5 m; lower investment; limited revenue ceiling; relies on ticket sales | 24–36 months |
| Mid-Scale Commercial Indoor Playground | Ceiling 4–6 m; mixed zones (soft play + light adventure); party rooms and retail | 18–30 months |
| High-Performance Adventure or Hybrid Playground | Ceiling 6 m+; high-capacity attractions; strong secondary spending | 18–24 months (sometimes faster) |
| Real-world caveat | “Expected” 12–18 month payback often stretches in practice | 36 months or longer |
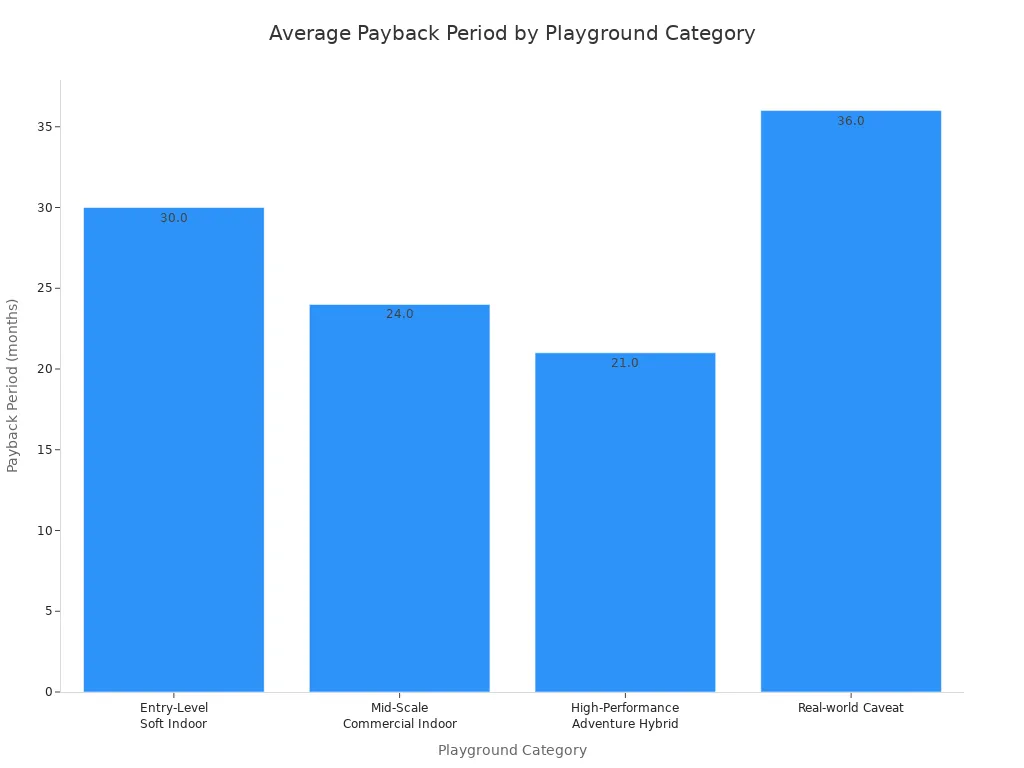
Well-operated assets often recover capital within 18 to 36 months. Some sources cite an average payback period of 6 months, which reflects unusually strong performance. Use the conservative end for planning. A shorter payback frees capital for upgrades and marketing. A realistic recovery timeline protects the profitability of your indoor playground project. Revisit your revenue projections as real data arrives. The profitability of your indoor playground improves when you update assumptions monthly. That habit strengthens your playground business ROI over time. It also keeps your indoor playground business honest about its indoor playground cost base. A disciplined indoor playground business treats return on investment as a living number, not a one-time guess. Your indoor playground investment then rests on evidence, not hope.
Check Your Plan With an Indoor Playground Business Plan
A good indoor playground business plan has nine parts. These include a short summary, a company description, market research, a marketing plan, an operations plan, a financial plan, and an appendix. Lenders and investors also want a full project budget, money estimates for each income source, operating costs with loan payments, realistic financial cases, and a cash reserve. Real startup costs, profit margins, and warning signs belong in the financial plan. This document can help you win funding and guide your choices.
Market research plus the business plan are the two must-do steps to confirm the project can work and will make money. Your indoor playground market analysis proves demand exists. The plan proves you can meet that demand at a profit. Finish both before you put money into opening an indoor playground.
Test Your Assumptions
Change visitor counts, pricing, and costs to see how profitability shifts. Build a model from your indoor playground revenue lines and your indoor playground cost base. The table below shows one worked stress test.
| Assumption line | Example figure | What it stress-tests |
|---|---|---|
| Fixed monthly costs | $28,000 | Rent, CAM, base payroll, insurance, utilities, software, cleaning |
| Open play contribution | 900 visits x $12 = $10,800 | Net of tax and variable costs, not gross ticket sales |
| Birthday party contribution | 24 parties x $260 = $6,240 | Net of host labor, supplies, cleaning, fees |
| Membership contribution | 120 members x $35 = $4,200 | Net of expected use and crowding cost |
| Groups and add-ons | $5,500 | Weekday groups, socks, vending, retail, lockers |
| Modeled contribution vs. fixed cost | $26,740 vs. $28,000 | Gap of -$1,260 signals assumptions need repair before proceeding |
That gap means the plan fails as written. Fix the assumptions before you go on. Test lower attendance and higher costs as separate cases. One break-even number is not safe, because each stream has a different margin and capacity limit.
According to the source, indoor playground venues typically achieve profitability within 2–3 years, and healthy profit margins fall in the range of 15% to 35%, varying based on the scale of the operation and its efficiency.
Set Benchmarks Before You Commit
Set go/no-go benchmarks before you put in money. Define the lowest visitor count, the average profit margin, and the highest indoor playground startup cost you will accept. Write them down. Then compare your stress-test results against them.
Your indoor playground investment needs a clear threshold. If the conservative case misses your benchmark, walk away or rework the plan. Check these numbers again as real data comes in. This habit protects the profitability of your indoor playground project and keeps your total investment under control.
You now have a repeatable sequence: run the indoor playground market analysis, size your investment, project profitability and payback, then validate everything in a business plan. Treat this as a process, not a one-time guess. Revisit your assumptions as real data arrives. Actual visitor counts, party bookings, and spend per visit will sharpen every projection. Check the profitability of your indoor playground against your benchmarks each quarter. A healthy indoor playground business builds recurring revenue and controls costs, so small corrections early protect your margins. Disciplined pre-investment analysis separates a confident decision from a hopeful one. Start with your own numbers today.
FAQ
How long should the evaluation take before you commit?
Give the process several weeks. You need time to count local families, visit competitors, and collect equipment quotes. Rushing this stage makes every later projection weaker. A careful indoor playground business treats this window as research, not delay. Finish the market analysis and the business plan first.
Which numbers should you gather first?
Start with three figures: expected monthly visitors, your average ticket price, and fixed monthly costs. These three drive your indoor playground cost model and your break-even point. Add party bookings and memberships next. An indoor playground business that gets these basics right can test every other assumption with confidence.
How do you know if your profit projection is realistic?
Compare your conservative case against published ranges. Healthy venues often net 15% to 35% and recover capital within 18 to 36 months. If your low case falls short, fix the assumptions. A credible indoor playground business plans on the conservative end, not the best case.
When should you walk away from a site?
Set your go/no-go benchmarks before you tour sites. Walk away when the conservative case misses your minimum visitor count, your target margin, or your maximum indoor playground cost. Discipline here protects your capital. A strong indoor playground business says no early rather than fix a weak location later.
How often should you revisit these projections?
Update your model monthly once you open. Real visitor counts and party bookings will sharpen every figure. Compare actual results against your benchmarks each quarter. This habit keeps your indoor playground business honest and keeps your indoor playground cost base visible. Profitability evaluation is a repeatable process, not a one-time guess.